Geospatial mailing list archives
geospatial@odoo-community.org
Browse archives
GeoEngine Questions
by
I downloaded GeoEngine and the demo module for Odoo13. Got installed and is all working and looks excellent.
My use case is as follows:
The customer is a scientific nursery that groups seedlings for clients. They are looking for a solution that will enable them to view their growing areas and understand utilisation at any time.
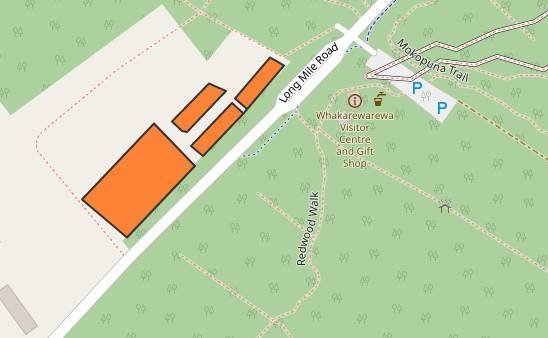
I decided to use stock.location as the model and have set up some sample data as below.
My first issue is I cannot see how to display the name field either within the shape or by clicking on (as the demo does). I have created a separate tree view but have only extended the base stock.location form view. Have added the various map views but not sure what I am missing.
My second issue is how to display an overlay. In project.project I have added a o2m for a new model project.location with location,start date and end date. So the project manager can define what locations this project will consume for what period. I have added an overlay with attribute_id = field_project_location__project – when I select this overlay all the mapped locations are coloured not just the one that has a linked project.
Any help you could give would be greatly appreciated.
Regards
Kevin McMenamin
ERP Capability Manager, Solnet
+64 22 651 3753 | +64 9 977 5805 | Visit our blog | Connect on LinkedIn
